
 Additional settings for Safari Browser.


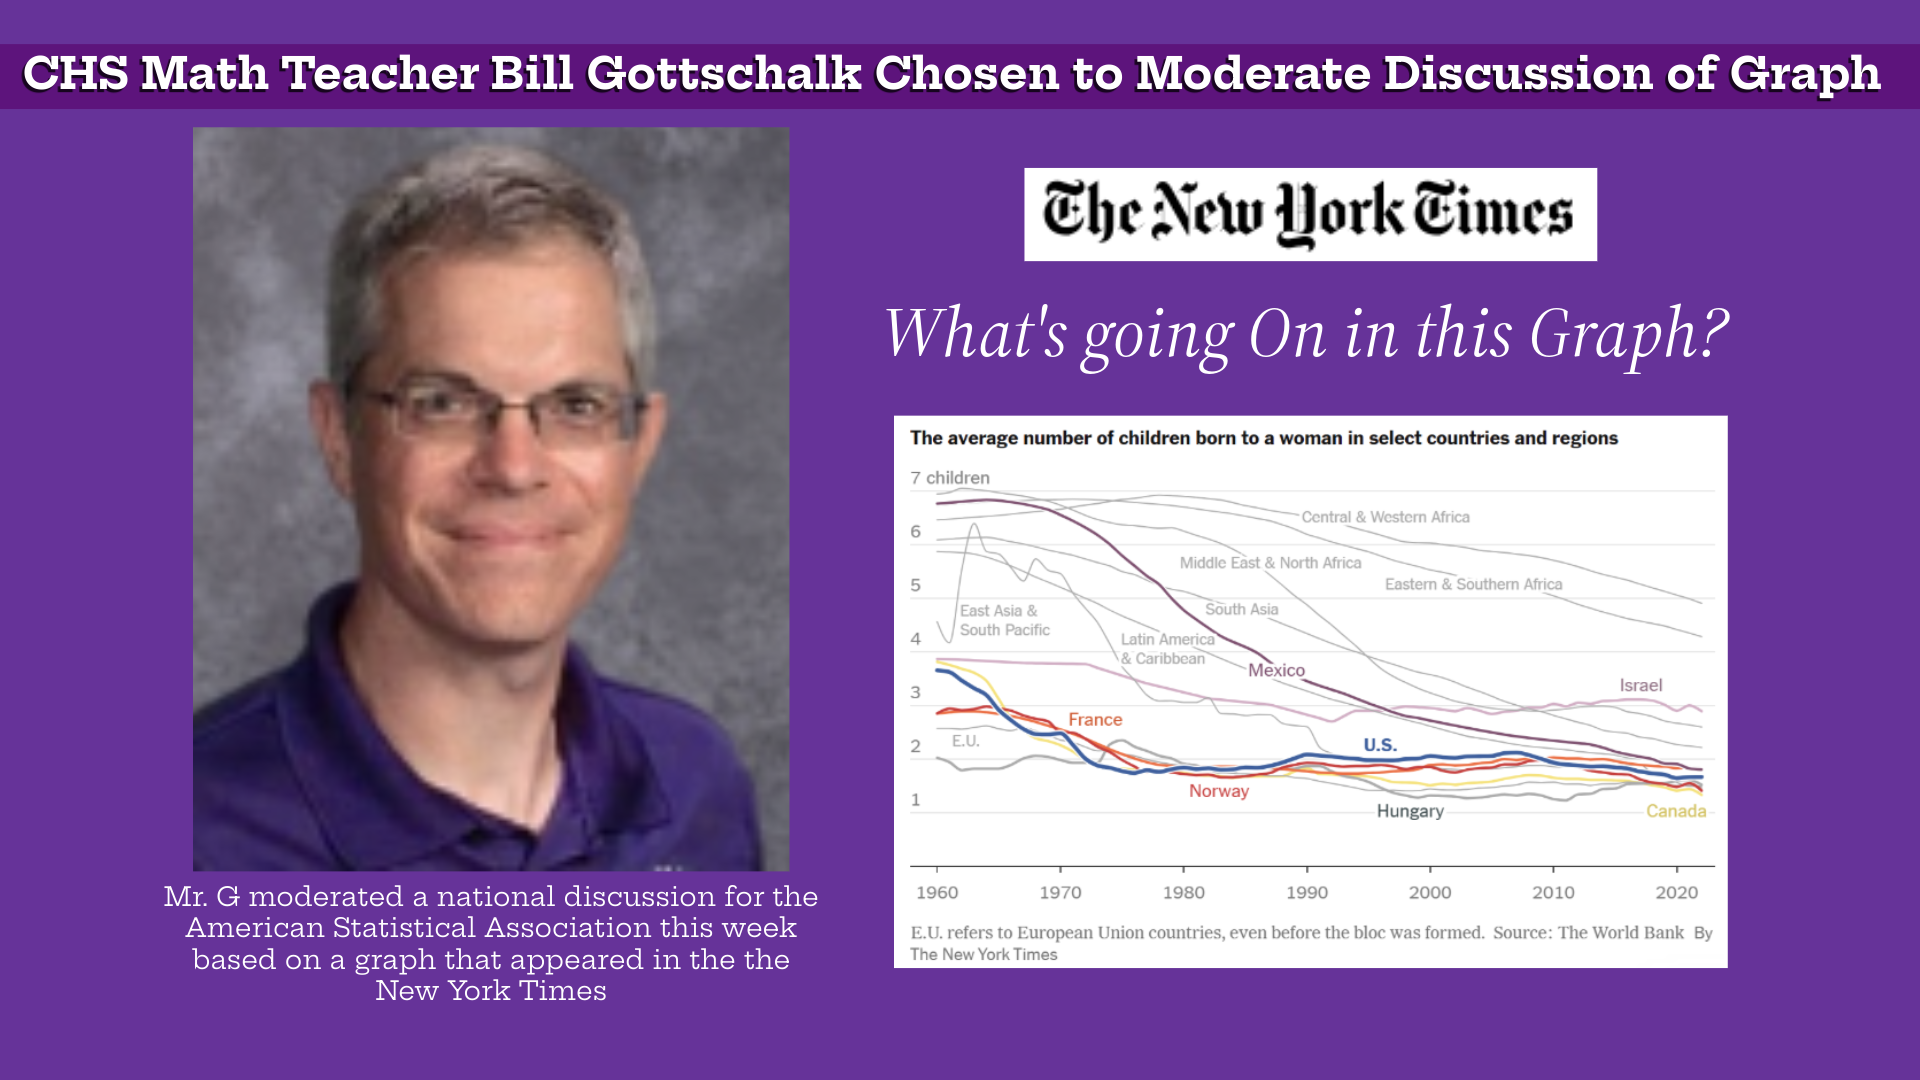
CHS Math Teacher Bill Gottschalk Chosen to Moderate National Student Discussion of New York Times Graph
 This week, Collinsville High School math teacher Bill Gottschalk is featured in the New York Times "What's Going On in This Graph?" Learning Network activity.
Gottschalk facilitated an online discussion of a graph pulled from the pages of the New York Times. This is the fifth time Gottschalk has had the honor of participating in this opportunity. He is chosen based on his active involvement with the American Statistical Association K-12 teachers program.
The graph depicts the average number of children born to a woman in select countries and regions between 1960 and 2020.
In addition to the graph, students are given several questions to consider to jumpstart their analysis. Here's the link to the graph, questions and resulting discussion. Over the last day, students have been posting their responses. On Friday, November 14, more information about the graph, including the accompanying NYT article, will be posted so students can contemplate their initial thoughts and add additional comments.
Mr. Gottschalk appears as "Moderator Bill, Collinsville, IL" in the discussion thread.
"Being able to participate in this feature of the New York Times over the last five years has been a fun, learning experience to connect with students around the country as they explore and analyze real-world news through these graphs," says Gottschalk.
"The 2.5 hour experience quickly flies by as I am responding to student comments, making notes of unique responses, and recording catchy 'headlines' students come up with to give them shout-outs at the end of the day."
Gottschalk enjoys the opportunity to see how students interpret the graph and what they bring to the discussion.
"I feel like you can tell which students are responding because they have genuine curiosity and interest, and which ones are responding because their teacher is making them write something. The best responses I read came from students who are currently taking AP Environmental Science. They were connecting what they had learned so far to try to explain the patterns they saw in the graph," he says.